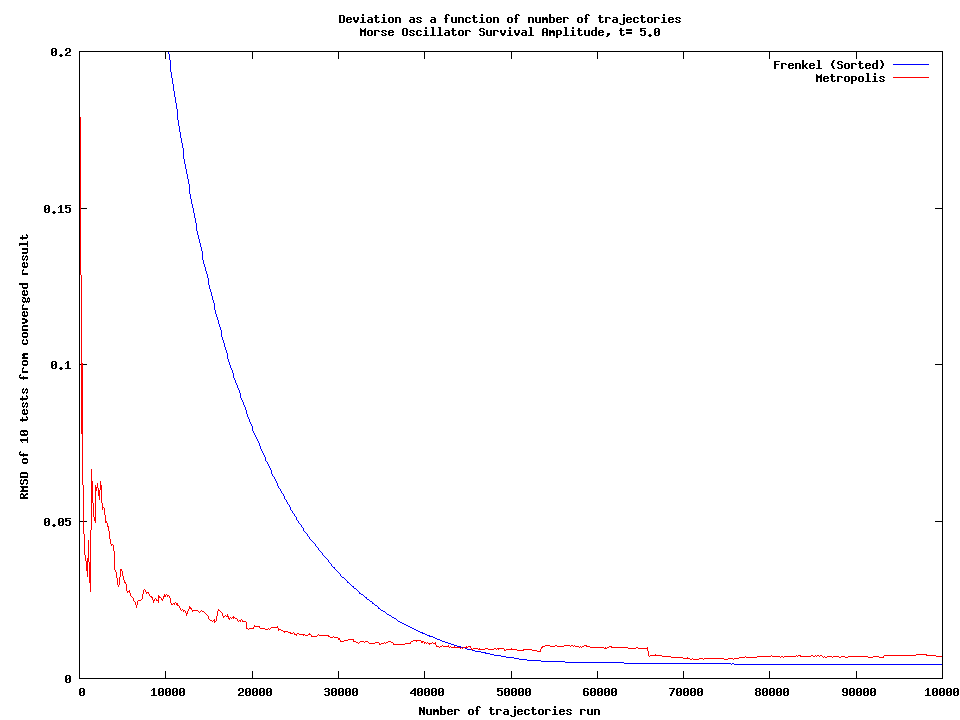
RMSD at time 5
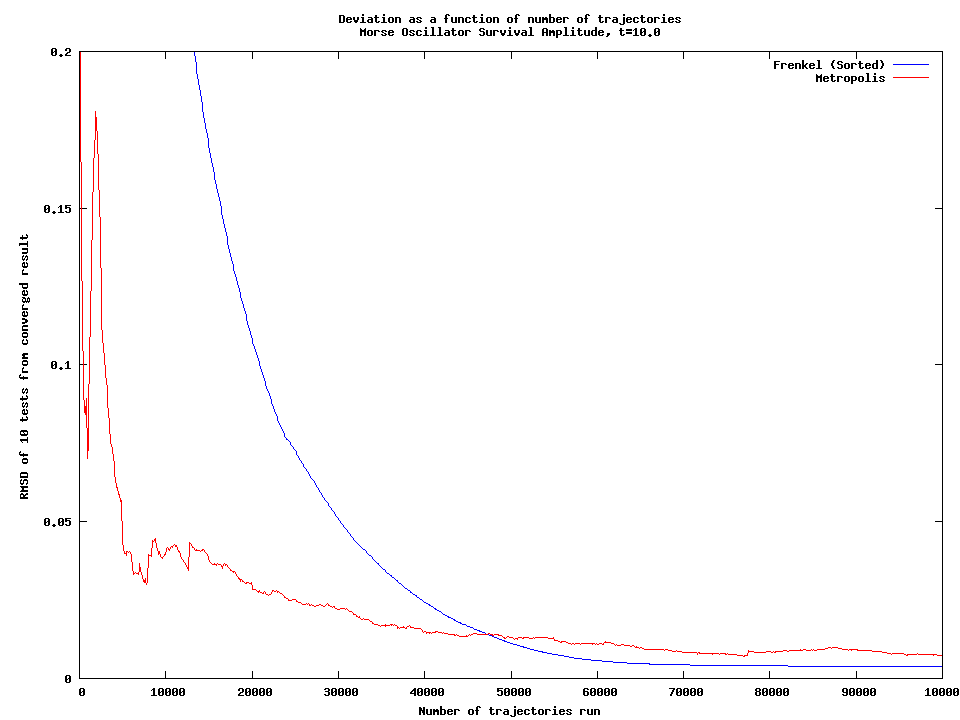
RMSD at time 10
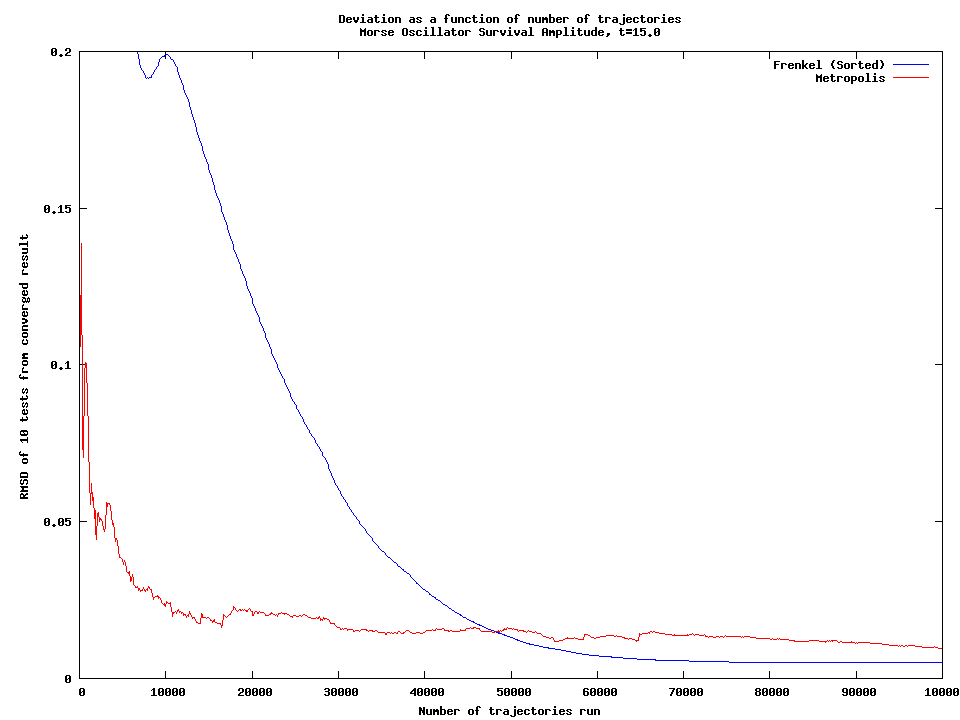
RMSD at time 15
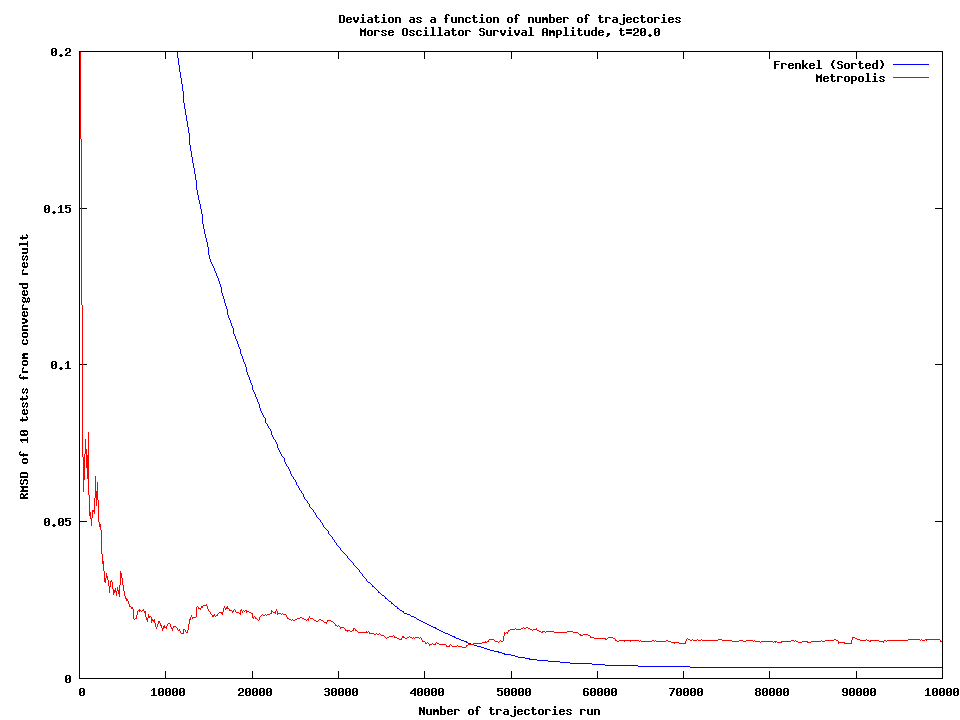
RMSD at time 20
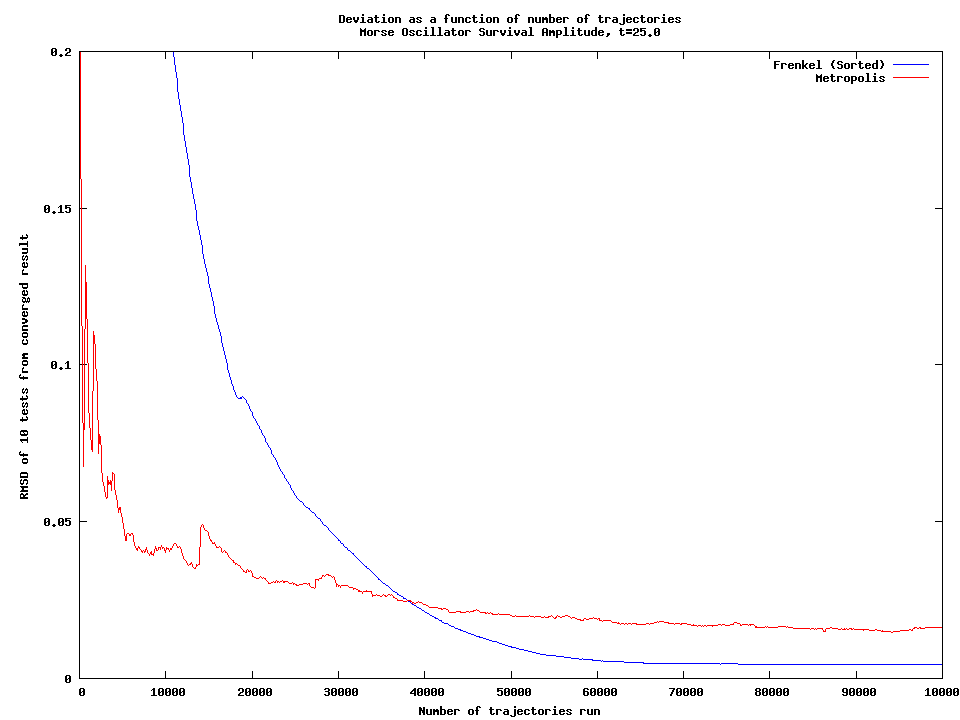
RMSD at time 25

Movie showing how the error bars and averages converge. This is just over the first 40k trajectories (it gets pretty boring, visually, after that).
This is, in a way, a repeat of the plots from May 19 of a similar name.
By using the RMSD instead of the standard deviation, I think we account for any unfairness in the comparison due to sorting.
Other associated files:
Tags: frenkel_testing, hess_normal, hk_prefactor_maslov, manolopoulos, mc_generate_frenkel, mc_generate_metrop, morse
The problem with this sorted version is that the tail of the weights distribution is relatively high. So it takes us about 75k trajectories to get to the point where we’re dealing with weights less than 0.01*w_max. In other words, this method gets worse as you go to larger numbers of trajectories, since there are more samples that are essentially repetitive near higher weights, and it takes longer to add in more useful information.
The trick is then to not sort the trajectories, but to just drop the least important ones.